
VICTORIA J. ABDULKADIR
DATA ANALYSTSkilled in Python, SQL, Excel, and Power BI, with experience building dashboards, analyzing trends, and predictive analytics.Trained in Data Science and AI governance, bringing both technical expertise and responsible, ethical practices to every project.Let’s explore how data can inform better decisions and deliver real impact.
Hi, I’m Victoria Abdulkadir. I’m a Data Analyst with a passion for turning raw data into actionable insights that drive smarter business decisions. I enjoy exploring diverse datasets, uncovering trends, and identifying opportunities that help organizations optimize strategies and improve outcomes.In this portfolio, you’ll find a selection of projects that demonstrate my skills in data analysis, visualization, and predictive modeling. Each project reflects my approach to solving real-world business problems, using data to tell clear, impactful stories.I’m always open to collaborating on challenging projects, connect with like-minded professionals, and explore how data can create meaningful value. Feel free to browse my work. I hope it inspires ideas for what we can achieve with data together.
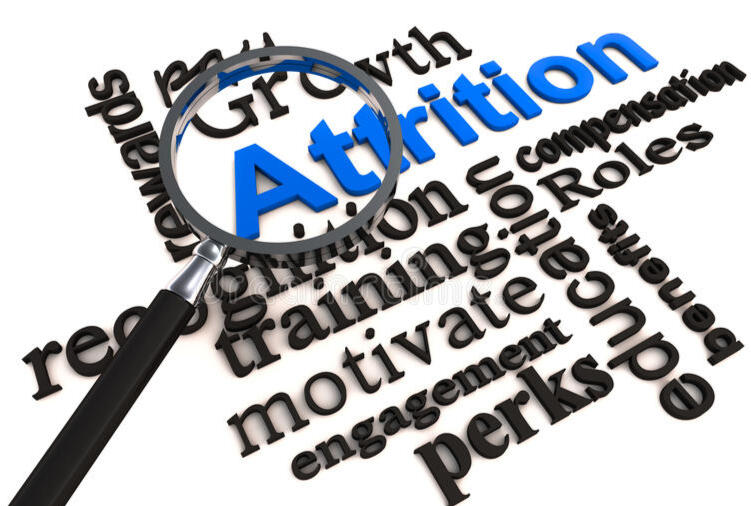
EMPLOYEE ATTRITION ANALYSIS
A detailed exploratory analysis on HR data to investigate employee's attrition rate for Vimaj Cosmetics, a leading local cosmetics brand. Data cleaning, manipulation, analysis, and visualizations were executed using R programming.

ONLINE COURSES PERFORMANCE ANALYSIS
A root cause analysis was carried out on all the courses on the organization's online educational platform to understand where opportunities existed for an increase in revenue, with focus on Web Development course.
Data consolidation, cleaning, and manipulation were implemented on Google Sheet while Tableau was employed for visualizations.

CONTENT CATEGORY ANALYSIS
A detailed analysis of a social media and content creation company that has gained popularity over the years was performed in order to highlight their top five most popular content categories.
The tasks adopted for successfully implementing this project were Project Understanding, Data Cleaning & Modeling using excel power query , Data Visualization & Storytelling using an interactive dashboard, as well as Presentation to the Client.

MARKETING STRATEGY OPTIMIZATION ANALYSIS
Dataset for a bikes & cycling accessories organization was effectively analyzed to help the company improve their marketing strategy. The steps applied to achieve this were evaluation of the dataset based on the seven Standard Data Quality Dimensions, Data Exploration, Model Development and Interpretation. Excel and Google Sheet were used for the cleaning, transformation, and pivot analysis while Looker and PowerPoint were utilized for visualization and presentation respectively.